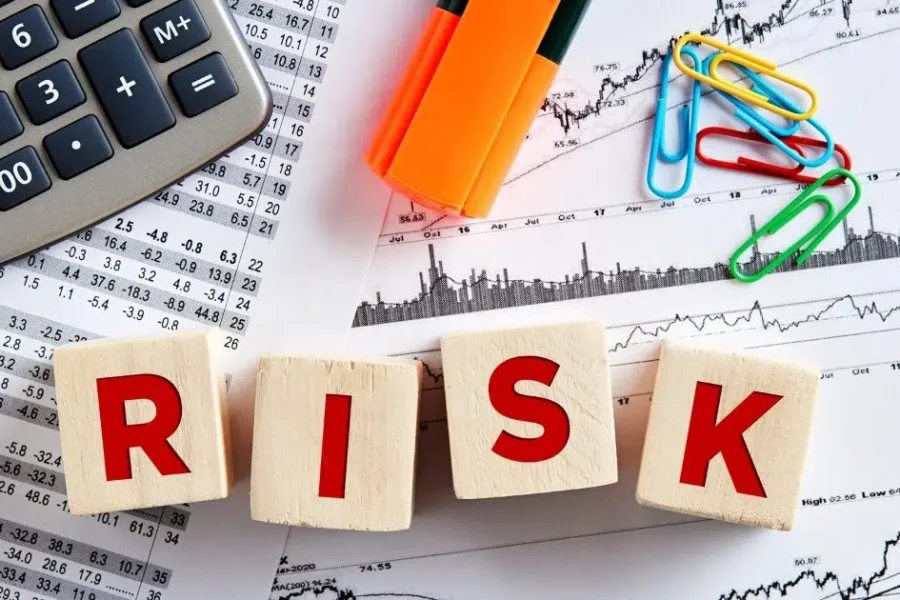
For the modern high-net-worth individual, the greatest threat to wealth isn’t necessarily market volatility but it’s about fragmentation. As your portfolio matures, it naturally becomes more complex.
What started as a simple brokerage account and a 401(k) eventually evolved into a sophisticated web of private equity stakes, various cryptocurrency cold wallets, real-estate holdings across different jurisdictions, and perhaps a collection of “passion assets” like fine art or vintage timepieces.
The problem? Most investors are managing this 21st-century portfolio with 20th-century tools.
When your financial data is scattered across a dozen different logins and static spreadsheet tabs, you are essentially flying a Gulfstream through a storm using only a compass. You might have a general sense of your direction, but you are operating on lagging indicators, for example data that is days, weeks, or even months old.
In the world of high-stakes investing, “roughly right” is often synonymous with “expensive.”
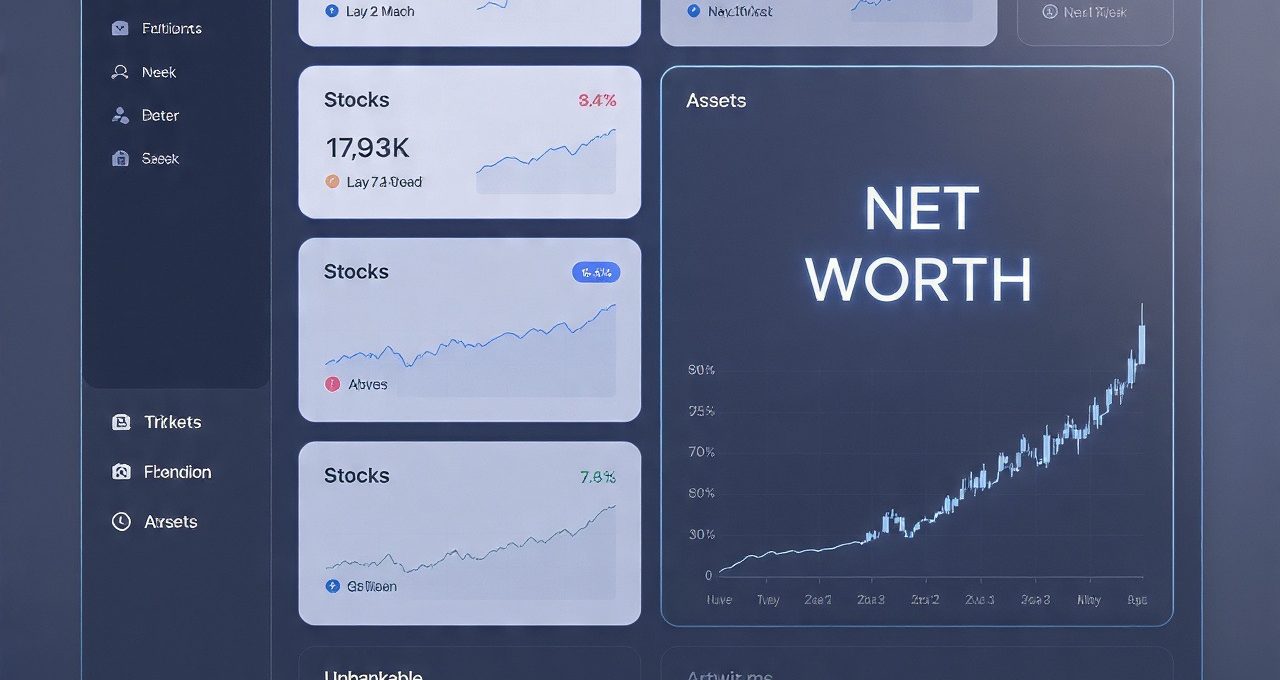
True wealth management is not defined by the sheer volume of assets you possess, but by the clarity of your visibility over them. To gain that clarity, you need a centralized “cockpit”, a professional-grade financial dashboard that serves as your single source of truth.
The Asset Allocation Drift
The most common investment blind spot is “drift.” Every sophisticated investor starts with a target asset allocation, a strategic balance between risk and reward. However, without a real-time view, your portfolio can become radically unbalanced without you ever placing a trade.
Consider the “Tech-Heavy Trap.” You might hold an S&P 500 index fund in your IRA, a specialized tech ETF in your personal brokerage, and several direct equity stakes in private startups. Individually, these accounts look fine. But without a consolidated view, you might not realize that your total exposure to the technology sector has crept up to 70% of your net worth.
When a sector-specific correction hits, you aren’t just “hit” but you’re devastated. Because your data was fragmented, you missed the window to rebalance. A modern dashboard eliminates this by aggregating these diverse holdings into a single view, allowing you to see your “True Allocation” across all accounts simultaneously. By the time a spreadsheet tells you that you’re over-leveraged, the market has already moved. Real-time visibility allows you to move first.
Why Spreadsheets are the “Silent Killer” of Scaling Wealth
There is a certain comfort in a spreadsheet. It’s private, it’s customizable, and it’s familiar. However, for the high-net-worth investor, the spreadsheet eventually ceases to be a tool and becomes a liability. We call this the “Silent Killer” because the damage it does is cumulative rather than immediate.
First, there is the integrity of the data. In a complex workbook, a single accidental keystroke or a broken cell reference can ripple through ten different tabs, resulting in a net worth figure that is off by a factor of thousands. When you are making lifestyle decisions or tax-loss harvesting based on that number, the margin for error is dangerously thin.
Second, the “Time Tax” is a drain on your most valuable non-renewable resource. If your Sunday ritual involves logging into six different brokerages, checking a crypto exchange, and manually updating a real estate appraisal, you aren’t an investor. You’ve become a data entry clerk. This manual process creates a psychological barrier; because it’s a chore, you do it less often, which only deepens your blind spots.
Finally, spreadsheets are static. They represent a snapshot of the past. In an era where markets move at the speed of an algorithm, relying on a spreadsheet is like trying to drive by looking only in the rearview mirror. By the time you’ve manually updated your cost basis, the opportunity to pivot has often passed.
The Anatomy of a Modern Financial Dashboard
To effectively eliminate blind spots, a dashboard must do more than just “list” your assets. It must provide a dynamic, multi-dimensional view of your financial life. A professional-grade system is built on four critical pillars:
- Automated Aggregation: Through secure API protocols, your dashboard should communicate directly with financial institutions. This ensures that when the market closes, your net worth reflects the final bell, not last week’s prices.
- The Inclusion of “Un-bankable” Assets: For many HNWIs, the majority of their wealth isn’t in a bank. It’s in private credit, commercial real estate, or collectibles. A modern dashboard allows you to track these alongside your liquid stocks, providing a holistic view that a standard banking app simply cannot match.
- Performance Analytics (IRR): Seeing that an asset has increased in value is basic. A sophisticated dashboard calculates your Internal Rate of Return (IRR), accounting for the timing of your capital inflows and outflows. This tells you if an investment is truly performing or if your gains are being eaten by the “time value of money.”
- Legacy and Beneficiary Planning: Wealth visibility isn’t just for you; it’s for your heirs. A digital “Life Vault” ensures that in the event of an emergency, your family doesn’t have to play detective to find where your assets are held.
Strategic Decision-Making: The “Dashboard Effect”
When you eliminate the friction of data collection, your relationship with your wealth changes. This is known as the “Dashboard Effect.” Instead of spending 90% of your time gathering data and 10% analyzing it, a professional all-in-one financial dashboard flips the script.
With a unified view, you can perform Opportunity Cost Analysis in real-time. For instance, if a high-yield private credit opportunity arises, you don’t need to spend hours wondering where to pull the capital from. You can instantly see which of your liquid assets are underperforming or where you are over-allocated. This agility is often the difference between securing a prime entry point and being left on the sidelines.
Furthermore, visibility acts as a hedge against Financial Anxiety. Much of the stress associated with high-stakes investing comes from the “unknown unknowns.” By having a clear, visual representation of your total liquidity and debt-to-asset ratio, you can navigate market downturns with a level head, knowing exactly how much “dry powder” you have to weather the storm.
Security in the Digital Age: Beyond the Login
One cannot discuss total wealth visibility without addressing the elephant in the room: security. For HNWIs, a spreadsheet on a local drive or a basic budgeting app is a security risk. A professional dashboard provides a “Read-Only” environment. By using encrypted aggregators, the dashboard displays your wealth without ever having the power to move it. This creates a “gap” between visibility and vulnerability, allowing you to monitor your global empire without increasing your digital attack surface.
From Reactive to Proactive
Wealth is rarely lost in a single catastrophic event; it is eroded by a thousand small blind spots. It is lost in the 1% “drag” of a forgotten account, the 5% “drift” of an unbalanced portfolio, and the hours of life-force spent wrestling with manual data entry.
In the modern era, information is the ultimate asset. To manage a complex portfolio without a centralized view is to accept a level of risk that is entirely avoidable. By transitioning to a dedicated financial dashboard, you aren’t just buying a piece of software; you are investing in a clearer perspective. You are moving from a reactive state of “hoping the numbers add up” to a proactive state of total command.
You cannot manage what you cannot see. It’s time to turn the lights on.